
Nationalism and anti-European sentiments have been on the rise in the past decade and have brought to life debates about the end or reversal of the process of European integration. The exit of the UK is of course the most drastic example, but scepticism about the economic benefits of EU membership are widespread. Economists have regularly assessed the economic consequences of undoing Europe, or, conversely, the benefits of maintaining or deepening the EU (Comerford and Rodriguez-Mora 2019, Mayer et al. 2018, 2019, Corcos et al. 2012).
In recent work, we add to the literature by taking the complex nature of European integration very seriously (Felbermayr et al. 2020). One source of complexity relates to what is often called the ‘variable geometry’ of the EU integration process. By now, 27 countries form the EU (EU27). Nineteen of them are members of the European Monetary Union. Twenty-two EU members participate in the Schengen Agreement, where they are joined by some, but not all, members of the European Free Trade Association (EFTA). Three of the four EFTA members, in turn, have joined the EU27 in forming the European Single Market. Moreover, the EU27 members’ budgets are linked through fiscal transfers, they form a Customs Union, and the EU as a legal entity has signed numerous regional trade agreements (RTAs) with countries all over the world. Therefore, a reversal of any or several steps of integration would affect European countries very differently.
A second source of complexity relates to the economic nature of integration. Over decades, deeply intertwined production processes in Europe and beyond have emerged, connecting firms from different sectors and countries. Hence, the economic effects of reversing an agreement would not be confined to its members, but would spill over to other countries along the demand and supply linkages that form the European and international production network.
In Felbermayr et al. (2020), we tackle both layers of complexity. Applying a state-of-the-art sector-level gravity model, we estimate the cost savings achieved through each individual step of integration and simulate the economic consequences of reversing all steps or individual steps in a general equilibrium trade model with many countries, cross-sectoral and cross-border production linkages. The model baseline is fitted to the global pattern of trade and production in 2014, including the geographic and sectoral structure of global production networks. Focusing on trade costs, we abstract from other dimensions of EU integration, such as common competition policy or macroeconomic policy coordination. Thus, we take our estimates as lower bounds of the true effects.
Large and heterogeneous effects, Single Market dominating
The estimated costs of a reversal of European integration are large, but vary greatly across agreements. Membership in the Single Market brings about 8 percentage points lower (non-tariff) trade costs in manufacturing and a 31 percentage points trade cost saving in services. Membership of the euro area yields trade cost savings of about 2 percentage points in goods and about 10 percentage points in services trade. The evaluation of the Schengen Agreement is more involved – how bilateral trade costs between two countries are affected depends on whether the transit countries between them are Schengen members (Felbermayr et al. 2016, 2018). Accounting for this complication, we find that abolishing border controls at one border reduces trade costs by 3 percentage points for goods and by 5 percentage points for services. Across 50 sectors, we detect a large degree of heterogeneity.
The unravelling of intra-EU trade and production networks
The simulated consequences of the trade cost hikes on trade and production in Europe are huge. Table 1 shows that a reversal of all agreements (Scenario “All (1)-(5)”) would slash intra-EU trade by almost 40%, compared to a 3% decline in exports to non-EU countries. Production and consumption in Europe are depressed; output falls by 7%, domestic sales (unaffected by trade cost increases!) drop by 3%. Higher border costs in Europe also destroy value chains. European value added in domestic sales drops even more than domestic sales as foreign sources become more competitive.
Table 1 Aggregate agreement-specific and cumulative output and export effects

Note: The table shows simulated effects of scenarios where agreements reserved individually or jointly. In the last scenario, intra-EU transfers payments are ended. All changes are measured in % of their baseline values in 2014, relative to the US price level.
Manufacturing takes the biggest hit and passes shocks on to upstream producers in all sectors. If all steps of integration were reversed, EU manufacturing exports would drop by 26%, compared to a decline in services exports of 12% (see Table 2). This results from initial differences in trade exposure; in 2014 only 10% of services produced in the EU were sold abroad, compared to an export share of 51% in manufacturing. Additionally, relative wage declines across Europe – an adjustment mechanism to counter the loss in competitiveness – are disproportionately effective at ameliorating the damages in the labour-intensive services sectors.
However, services are not entirely shielded, as they serve as essential inputs to domestic manufacturing producers. The positive changes in services VAX ratios displayed in Table 2 show that services value added originating in Europe and consumed abroad drops by more than services exported directly.
Table 2 Sector-specific export and value-added export effects in Scenario “All (1)-(5)”
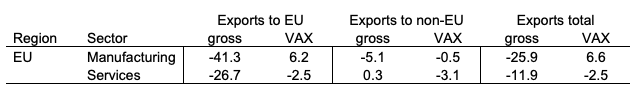
Note: VAX denotes the ratio of gross exports to value added exports. Gross export changes in % of baseline value in 2014, relative to US price level; changes in VAX ratios in percentage points.
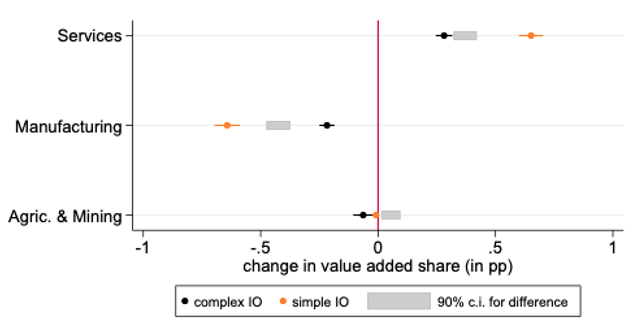
Figure 1 shows that the net effect of the sectoral adjustments resulting from undoing Europe is deindustrialisation: manufacturing in the EU loses about 0.2 percentage points of its share in total value added in the baseline simulation (black dots). Figure 2 reveals that accounting for upstream and downstream production linkages is important for understanding the sectoral adjustment patterns. A simple model without cross-sectoral production linkages (orange dots) vastly overstates (understates) the impact on the manufacturing (services) sector as it fails to account for the indirect impacts transmitted along the value chain.
Figure 1 Relative decline of the manufacturing sector in Europe
Consumption losses are sizeable, intra-EU convergence is reversed
A complete breakdown of the EU would generate statistically significant real consumption losses for all EU members (see Table 3). Small open countries such as Malta, Luxembourg, Belgium, and Ireland would lose 20%, 19%, 12%, and 11%, respectively; larger countries such as Germany, France and Italy would lose 5%, 4%, and 4%, respectively. The least exposed EU country is Greece (-3%). Besides the small open economies, younger and poorer EU members from central and Eastern Europe have the most to lose. Being disproportionately reliant on demand from Europe and, compared for example to Germany, being less integrated in international production networks with global players such as China and the US, border barriers to intra-EU trade are hitting these states disproportionally hard. Reintroducing tariffs equal to current EU MFN tariffs could have positive (albeit tiny) effects on real consumption in several countries, such as Cyprus or Portugal. The losses from dissolving the Single Market dominate the overall effect.
Table 3 Agreement-specific and cumulative real consumption losses from reversing the European Integration (in %)
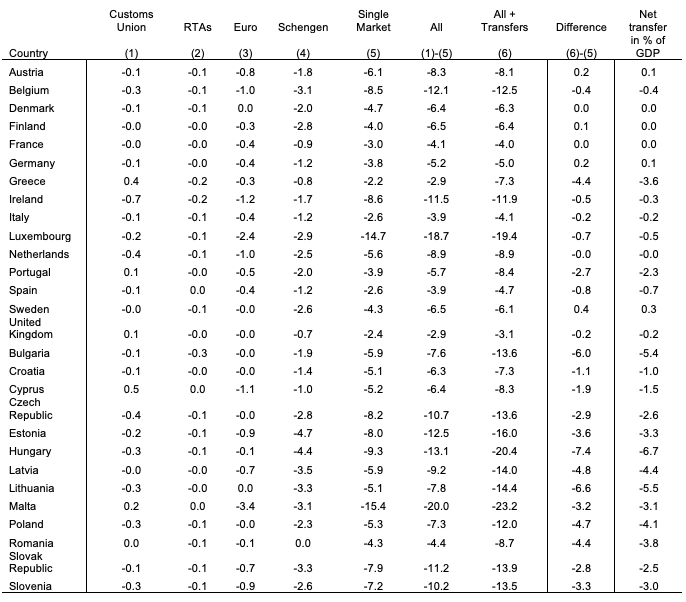
Note: The table shows simulated changes in real consumption (in % of the 2014 baseline). The last columns shows all countries’ net contributions to the EU budget in % of GDP (average 2010-2014).
Loss of transfers adds significantly to new EU members’ losses and brings terms-of-trade gains for net contributors like Germany.
Putting an end to within-EU budget transfers creates further pain for the new EU members, slashing additional 7 percentage points (7 percentage points, 6 percentage points, 5 percentage points, 55 percentage points) off of real consumption in Hungary (Lithuania, Bulgaria, Latvia, Poland) (see Table 3, Column titled “Difference (6)-(5)”). These losses of net transfer recipients result from a direct loss of income equal to the transfer (last column in Table 3) and are enhanced by adverse terms-of-trade effects. To restore a constant deficit, initial net recipients need to make up for the lost transfer income by means of higher exports, which are achieved through a decline in the relative wage level. Conversely, ending transfers reduces the losses from a reversal of the steps of integration for net contributors like Germany, Sweden, Austria and Finland and brings positive terms of trade effects. Yet, these positive effects are an order of magnitude smaller than the losses associated with re-establishing the border barriers in Europe.
References
Comerford, D and S Rodriguez Mora (2019), “The gains from economic integration”, Economic Policy 34: 201-266 (see also the Vox column here).
Corcos, G, M Del Gatto, G Mion, and G Ottaviano (2012), “Productivity and firm selection: Quantifying the ‘new’ gains from trade”, The Economic Journal 122: 754-798 (see also the Vox column here).
Felbermayr, G, J Gröschl, and I Heiland (2020), “Complex Europe: Quantifying the Cost of Disintegration”, CEPR Discussion Paper 15200.
Felbermayr, G, J Gröschl, and T Steinwachs (2018), “The trade effects of border controls: Evidence from the European Schengen Agreement”, Journal of Common Market Studies 56: 335-351 (see also the Vox column here).
Mayer, T, V Vicard, and S Zignago (2019), “Revisiting the cost of non-Europe“, Economic Policy 34: 145-199 (see also the Vox column here).